Setting Up Dashboards

  • Prometheus is a monitoring platform that collects metrics from monitored targets by scraping metrics HTTP endpoints on these targets. Official documentation is available here.

  • Grafana is a dashboard used to visualize the collected data.

🐣 Installing Prometheus and Grafana

Install prometheus and prometheus node exporter.

sudo apt-get install -y prometheus prometheus-node-exporter 

Install grafana.

sudo apt-get install -y apt-transport-https
sudo apt-get install -y software-properties-common wget
sudo wget -q -O /usr/share/keyrings/grafana.key https://apt.grafana.com/gpg.key
echo "deb [signed-by=/usr/share/keyrings/grafana.key] https://apt.grafana.com stable main" | sudo tee -a /etc/apt/sources.list.d/grafana.list
sudo apt-get update && sudo apt-get install -y grafana

Enable services so they start automatically.

sudo systemctl enable grafana-server.service
sudo systemctl enable prometheus.service
sudo systemctl enable prometheus-node-exporter.service

Update prometheus.yml located in /etc/prometheus/prometheus.yml

Change the <block producer ip address> in the following command.

cat > prometheus.yml << EOF
global:
  scrape_interval:     15s # By default, scrape targets every 15 seconds.

  # Attach these labels to any time series or alerts when communicating with
  # external systems (federation, remote storage, Alertmanager).
  external_labels:
    monitor: 'codelab-monitor'

# A scrape configuration containing exactly one endpoint to scrape:
# Here it's Prometheus itself.
scrape_configs:
  # The job name is added as a label job=<job_name> to any timeseries scraped from this config.
  - job_name: 'prometheus'

    static_configs:
	
      - targets: ['localhost:9100']
        labels:
          alias: 'relaynode1'
          type:  'prometheus-node-exporter'
		  
      - targets: ['<block producer ip address>:9100']
        labels:
          alias: 'block-producer-node'
          type:  'prometheus-node-exporter'
		  
      - targets: ['<block producer ip address>:12798']
        labels:
          alias: 'block-producer-node'
          type:  'cardano-node'
		  
      - targets: ['localhost:12798']
        labels:
          alias: 'relaynode1'
          type:  'cardano-node'
EOF
sudo mv prometheus.yml /etc/prometheus/prometheus.yml

Finally, restart the services.

sudo systemctl restart grafana-server.service
sudo systemctl restart prometheus.service
sudo systemctl restart prometheus-node-exporter.service

Verify that the services are running properly:

sudo systemctl status grafana-server.service prometheus.service prometheus-node-exporter.service

Update config.json config files with new hasEKG and hasPrometheus ports.

cd $NODE_HOME

sed -i config.json -e "s/127.0.0.1/0.0.0.0/g"  

A note on port forwarding and firewall configuration.

Block producer node ports 12798 and 9100 should be reachable from the relaynode1, which is hosting Prometheus and Grafana.

  • Port 12798 is for Cardano-Node's prometheus metrics.

  • Port 9100 is for node-exporter metrics.

Stop and restart your stake pool.

sudo systemctl restart cardano-node

Verify the metrics are working by querying the prometheus port.

curl -s 127.0.0.1:12798/metrics

# Example output:
# rts_gc_par_tot_bytes_copied 123
# rts_gc_num_gcs 345
# rts_gc_max_bytes_slop 4711111
# cardano_node_metrics_served_block_count_int 8112
# cardano_node_metrics_Stat_threads_int 8
# cardano_node_metrics_density_real 4.67
🔥 Grafana Security: SSH Tunnels

Do not expose Grafana (port 3000) to the public internet as this invites a new attack surface! A secure solution would be to access Grafana through a ssh tunnel.

Example of how to create a ssh tunnel in Linux or MacOS:

ssh -N -v <user>@<staking.node.ip.address> -L 3000:localhost:3000

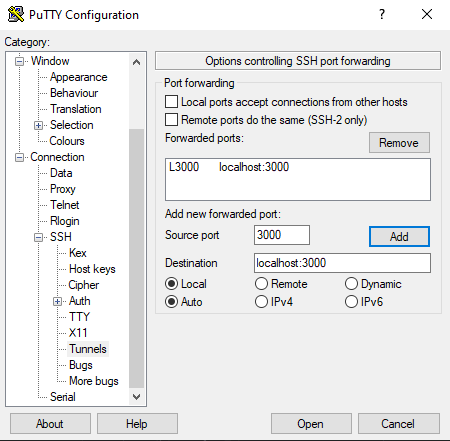
Example of how to create a ssh tunnel in Windows with Putty:

Navigate to Connection > SSH > Tunnels > Enter Source Port 3000 > Enter Destination localhost:3000 > Click Add

Now you can access Grafana on your local machine by pointing a web browser to http://localhost:3000

📶 Configuring Grafana

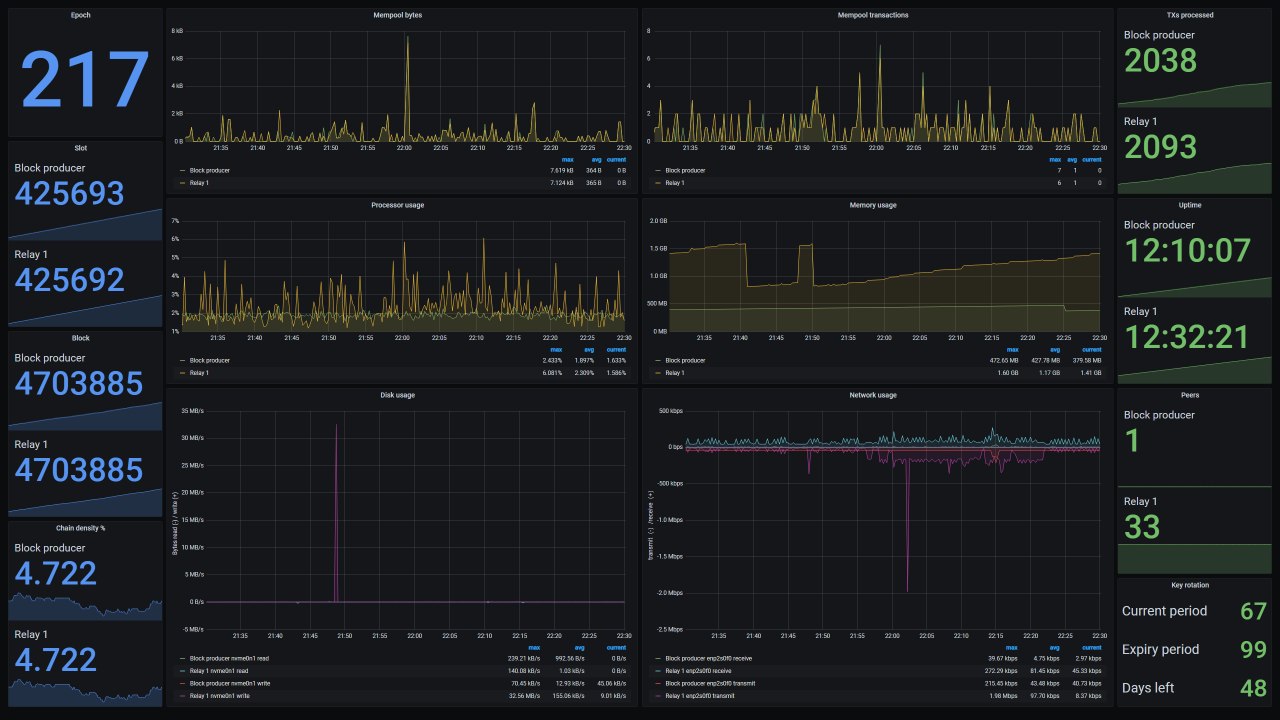
  1. Open http://localhost:3000 (if using ssh tunnel or on relaynode1) or http://<your relaynode1 ip address>:3000 in your local browser.

  2. Login with admin / admin

  3. Change password

  4. Click the configuration gear icon, then Add data Source

  5. Select Prometheus

  6. Set Name to "Prometheus"

  7. Set URL to http://localhost:9090

  8. Click Save & Test

  9. Download and save this json file.

  10. Click Create + icon > Import

  11. Add dashboard by Upload JSON file

  12. Click the Import button.

Community contributer SNSKY is sharing a very detailed Grafana tutorial 🙏 https://sanskys.github.io/grafana/

Congratulations. You're basically done. More great operational and maintenance tips in section 18.

Be sure to review the Stake Pool Operator's Best Practices Checklist to ensure smooth sailing with your pool.