> For the complete documentation index, see [llms.txt](https://www.coincashew.com/llms.txt). Markdown versions of documentation pages are available by appending `.md` to page URLs; this page is available as [Markdown](https://www.coincashew.com/spanish/coins/overview-eth/archived-guides/guide-or-how-to-setup-a-validator-on-eth2-mainnet/part-i-installation/monitoring-your-validator-with-grafana-and-prometheus.md).
# Monitoring your validator with Grafana and Prometheus
Prometheus is a monitoring platform that collects metrics from monitored targets by scraping metrics HTTP endpoints on these targets. [Official documentation is available here.](https://prometheus.io/docs/introduction/overview/) Grafana is a dashboard used to visualize the collected data.
### 6.1 Installation
Install prometheus and prometheus node exporter.
```
sudo apt-get install -y prometheus prometheus-node-exporter
```
Install grafana.
```bash
wget -q -O - https://packages.grafana.com/gpg.key | sudo apt-key add -
echo "deb https://packages.grafana.com/oss/deb stable main" > grafana.list
sudo mv grafana.list /etc/apt/sources.list.d/grafana.list
sudo apt-get update && sudo apt-get install -y grafana
```
Enable services so they start automatically.
```bash
sudo systemctl enable grafana-server.service prometheus.service prometheus-node-exporter.service
```
Create the **prometheus.yml** config file. Choose the tab for your eth client. Simply copy and paste.
{% tabs %}
{% tab title="Lighthouse" %}
```bash
cat > $HOME/prometheus.yml << EOF
global:
scrape_interval: 15s # By default, scrape targets every 15 seconds.
# Attach these labels to any time series or alerts when communicating with
# external systems (federation, remote storage, Alertmanager).
external_labels:
monitor: 'codelab-monitor'
# A scrape configuration containing exactly one endpoint to scrape:
# Here it's Prometheus itself.
scrape_configs:
- job_name: 'node_exporter'
static_configs:
- targets: ['localhost:9100']
- job_name: 'nodes'
metrics_path: /metrics
static_configs:
- targets: ['localhost:5054']
- job_name: 'validators'
metrics_path: /metrics
static_configs:
- targets: ['localhost:5064']
EOF
```
{% endtab %}
{% tab title="Nimbus" %}
```bash
cat > $HOME/prometheus.yml << EOF
global:
scrape_interval: 15s # By default, scrape targets every 15 seconds.
# Attach these labels to any time series or alerts when communicating with
# external systems (federation, remote storage, Alertmanager).
external_labels:
monitor: 'codelab-monitor'
# A scrape configuration containing exactly one endpoint to scrape:
# Here it's Prometheus itself.
scrape_configs:
- job_name: 'node_exporter'
static_configs:
- targets: ['localhost:9100']
- job_name: 'nodes'
metrics_path: /metrics
static_configs:
- targets: ['localhost:8008']
EOF
```
{% endtab %}
{% tab title="Teku" %}
```bash
cat > $HOME/prometheus.yml << EOF
global:
scrape_interval: 15s # By default, scrape targets every 15 seconds.
# Attach these labels to any time series or alerts when communicating with
# external systems (federation, remote storage, Alertmanager).
external_labels:
monitor: 'codelab-monitor'
# A scrape configuration containing exactly one endpoint to scrape:
# Here it's Prometheus itself.
scrape_configs:
- job_name: 'node_exporter'
static_configs:
- targets: ['localhost:9100']
- job_name: 'nodes'
metrics_path: /metrics
static_configs:
- targets: ['localhost:8008']
EOF
```
{% endtab %}
{% tab title="Prysm" %}
```bash
cat > $HOME/prometheus.yml << EOF
global:
scrape_interval: 15s # By default, scrape targets every 15 seconds.
# Attach these labels to any time series or alerts when communicating with
# external systems (federation, remote storage, Alertmanager).
external_labels:
monitor: 'codelab-monitor'
# A scrape configuration containing exactly one endpoint to scrape:
# Here it's Prometheus itself.
scrape_configs:
- job_name: 'node_exporter'
static_configs:
- targets: ['localhost:9100']
- job_name: 'validator'
static_configs:
- targets: ['localhost:8081']
- job_name: 'beacon node'
static_configs:
- targets: ['localhost:8080']
- job_name: 'slasher'
static_configs:
- targets: ['localhost:8082']
EOF
```
{% endtab %}
{% tab title="Lodestar" %}
```bash
cat > $HOME/prometheus.yml << EOF
scrape_configs:
- job_name: 'node_exporter'
static_configs:
- targets: ['localhost:9100']
- job_name: 'Lodestar'
metrics_path: /metrics
static_configs:
- targets: ['localhost:8008']
EOF
```
{% endtab %}
{% endtabs %}
Setup prometheus for your execution client. Start by editing **prometheus.yml**
```bash
nano $HOME/prometheus.yml
```
Append the applicable job snippet for your execution client to the end of **prometheus.yml**. Save the file.
{% hint style="warning" %}
**Spacing matters**. Ensure all `job_name` snippets are in alignment.
{% endhint %}
{% tabs %}
{% tab title="Geth" %}
```bash
- job_name: 'geth'
scrape_interval: 15s
scrape_timeout: 10s
metrics_path: /debug/metrics/prometheus
scheme: http
static_configs:
- targets: ['localhost:6060']
```
{% endtab %}
{% tab title="Besu" %}
```bash
- job_name: 'besu'
scrape_interval: 15s
scrape_timeout: 10s
metrics_path: /metrics
scheme: http
static_configs:
- targets:
- localhost:9545
```
{% endtab %}
{% tab title="Nethermind" %}
```bash
- job_name: 'nethermind'
static_configs:
- targets: ['localhost:6060']
```
{% endtab %}
{% tab title="Erigon" %}
```bash
- job_name: 'erigon'
scrape_interval: 10s
scrape_timeout: 3s
metrics_path: /debug/metrics/prometheus
scheme: http
static_configs:
- targets: ['localhost:6060']
```
{% endtab %}
{% endtabs %}
Move it to `/etc/prometheus/prometheus.yml`
```bash
sudo mv $HOME/prometheus.yml /etc/prometheus/prometheus.yml
```
Update file permissions.
```bash
sudo chmod 644 /etc/prometheus/prometheus.yml
```
Finally, restart the services.
```bash
sudo systemctl restart grafana-server.service prometheus.service prometheus-node-exporter.service
```
Verify that the services are running properly:
```
sudo systemctl status grafana-server.service prometheus.service prometheus-node-exporter.service
```
🔥 Grafana Security: SSH Tunnels
Do not expose Grafana (port 3000) to the public internet as this invites a new attack surface! A secure solution would be to access Grafana through a ssh tunnel.
Example of how to create a ssh tunnel in Linux or MacOS:
```
ssh -N -v @ -L 3000:localhost:3000
```
Example of how to create a ssh tunnel in Windows with [Putty](https://putty.org/):
Navigate to Connection > SSH > Tunnels > Enter Source Port `3000` > Enter Destination `localhost:3000` > Click Add
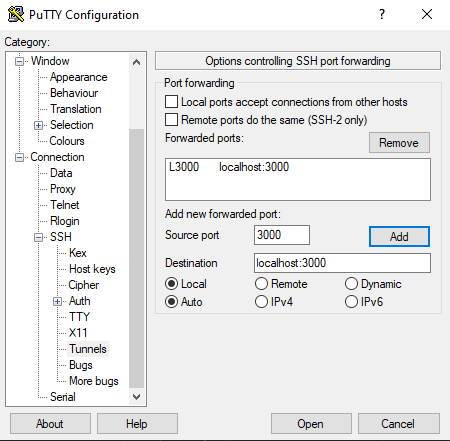
Now you can access Grafana on your local machine by pointing a web browser to [http://localhost:3000](http://localhost:3000/)
### :signal\_strength: 6.2 Setting up Grafana Dashboards
1. Open or http\://\:3000 in your web browser.
2. Login with **admin** / **admin**
3. Change password
4. Click the **configuration gear** icon, then **Add data Source**
5. Select **Prometheus**
6. Set **Name** to **"Prometheus**"
7. Set **URL** to
8. Click **Save & Test**
9. **Download and save** your consensus client's json file. More json dashboard options available below. \[ [Lighthouse](https://raw.githubusercontent.com/Yoldark34/lighthouse-staking-dashboard/main/Yoldark_ETH_staking_dashboard.json) | [Teku ](https://grafana.com/api/dashboards/13457/revisions/2/download)| [Nimbus ](https://raw.githubusercontent.com/status-im/nimbus-eth2/master/grafana/beacon_nodes_Grafana_dashboard.json)| [Prysm ](https://raw.githubusercontent.com/GuillaumeMiralles/prysm-grafana-dashboard/master/less_10_validators.json)| [Prysm > 10 Validators](https://raw.githubusercontent.com/GuillaumeMiralles/prysm-grafana-dashboard/master/more_10_validators.json) | [Lodestar](https://raw.githubusercontent.com/ChainSafe/lodestar/unstable/dashboards/lodestar_summary.json) ]
10. **Download and save** your execution client's json file \[ [Geth](https://gist.githubusercontent.com/karalabe/e7ca79abdec54755ceae09c08bd090cd/raw/3a400ab90f9402f2233280afd086cb9d6aac2111/dashboard.json) | [Besu ](https://grafana.com/api/dashboards/10273/revisions/5/download)| [Nethermind ](https://raw.githubusercontent.com/NethermindEth/metrics-infrastructure/master/grafana/dashboards/nethermind.json)| [Erigon](https://raw.githubusercontent.com/ledgerwatch/erigon/devel/cmd/prometheus/dashboards/erigon.json) ]
11. **Download and save** a [node-exporter dashboard](https://grafana.com/api/dashboards/11074/revisions/9/download) for general system monitoring
12. Click **Create +** icon > **Import**
13. Add the consensus client dashboard via **Upload JSON file**
14. If needed, select Prometheus as **Data Source**.
15. Click the **Import** button.
16. Repeat steps 12-15 for the execution client dashboard.
17. Repeat steps 12-15 for the node-exporter dashboard.
{% hint style="warning" %}
:fire: **Troubleshooting common Grafana issues**
**Symptom**: Your dashboard is missing some data*.*
**Solution***:* Ensure that the execution or consensus client has enabled the appropriate metrics flag.
* Geth: geth --http --metrics --pprof
* Besu: besu --metrics-enabled=true
* Nethermind: Nethermind.Runner --Metrics.Enabled true
* Erigon: erigon --metrics
* Lighthouse beacon-node: lighthouse bn --validator-monitor-auto
* Nimbus: nimbus\_beacon\_node --metrics --metrics-port=8008
* Teku: --metrics-enabled=true --metrics-port=8008
* Lodestar beacon-node: lodestar beacon --metrics true
{% endhint %}
#### Example of Grafana Dashboards for each consensus client.
{% tabs %}
{% tab title="Lighthouse" %}


Beacon Chain JSON Download link:
Validator Client JSON download link:
Credits:

JSON Download link:
Credits:
{% endtab %}
{% tab title="Nimbus" %}

Credits:

JSON download link:
Credits:
{% endtab %}
{% tab title="Teku" %}

Credits:
{% endtab %}
{% tab title="Prysm" %}

Credits:

JSON download link:
Credits:
{% endtab %}
{% tab title="Lodestar" %}
Work in progress.
{% endtab %}
{% endtabs %}
#### Example of Grafana Dashboards for each execution client.
{% tabs %}
{% tab title="Geth" %}

Credits:
{% endtab %}
{% tab title="Besu" %}

Credits:
{% endtab %}
{% tab title="Nethermind" %}

Credits:
{% endtab %}
{% tab title="Erigon" %}

Credits:
{% endtab %}
{% endtabs %}
#### Example of Node-Exporter Dashboard
{% tabs %}
{% tab title="Node-Exporter Dashboard by starsliao" %}
**General system monitoring**
Includes: CPU, memory, disk IO, network, temperature and other monitoring metrics。


Credits: [starsliao](https://grafana.com/grafana/dashboards/11074)
{% endtab %}
{% endtabs %}
### :warning: 6.3 Setup Alert Notifications
{% hint style="info" %}
Setup alerts to get notified if your validators go offline.
{% endhint %}
Get notified of problems with your validators. Choose between email, telegram, discord or slack.
{% tabs %}
{% tab title="Email Notifications" %}
1. Visit [https://beaconcha.in/](https://beaconcha.in)
2. Sign up for an account.
3. Verify your **email**
4. Search for your **validator's public address**
5. Add validators to your watchlist by clicking the **bookmark symbol**.
{% endtab %}
{% tab title="Telegram Notifications" %}
1. On the menu of Grafana, select **Notification channels** under the bell icon.
2. Click on **Add channel**.
3. Give the notification channel a **name**.
4. Select **Telegram** from the Type list.
5. To complete the **Telegram API settings**, a **Telegram channel** and \*\*bot \*\*are required. For instructions on setting up a bot with `@Botfather`, see [this section](https://core.telegram.org/bots#6-botfather) of the Telegram documentation. You need to create a BOT API token.
6. Create a new telegram group.
7. Invite the bot to your new group.
8. Type at least 1 message into the group to initialize it.
9. Visit [`https://api.telegram.org/botXXX:YYY/getUpdates`](https://api.telegram.org/botXXX:YYY/getUpdates) where `XXX:YYY` is your BOT API Token.
10. In the JSON response, find and copy the **Chat ID**. Find it between \*\*chat \*\*and **title**. *Example of Chat ID*: `-1123123123`
```
"chat":{"id":-123123123,"title":
```
11. Paste the **Chat ID** into the corresponding field in **Grafana**.
12. **Save and test** the notification channel for your alerts.
13. Now you can create custom alerts from your dashboards. [Visit here to learn how to create alerts.](https://grafana.com/docs/grafana/latest/alerting/create-alerts/)
{% endtab %}
{% tab title="Discord Notifications" %}
1. On the menu of Grafana, select **Notification channels** under the bell icon.
2. Click on **Add channel**.
3. Add a **name** to the notification channel.
4. Select **Discord** from the Type list.
5. To complete the set up, a Discord server (and a text channel available) as well as a Webhook URL are required. For instructions on setting up a Discord's Webhooks, see [this section](https://support.discord.com/hc/en-us/articles/228383668-Intro-to-Webhooks) of their documentation.
6. Enter the Webhook **URL** in the Discord notification settings panel.
7. Click **Send Test**, which will push a confirmation message to the Discord channel.
{% endtab %}
{% tab title="Slack Notifications" %}
1. On the menu of Grafana, select **Notification channels** under the bell icon.
2. Click on **Add channel**.
3. Add a **name** to the notification channel.
4. Select **Slack** from the Type list.
5. For instructions on setting up a Slack's Incoming Webhooks, see [this section](https://api.slack.com/messaging/webhooks) of their documentation.
6. Enter the Slack Incoming Webhook URL in the **URL** field.
7. Click **Send Test**, which will push a confirmation message to the Slack channel.
{% endtab %}
{% endtabs %}