Monitoring your validator with Grafana and Prometheus

Prometheus is a monitoring platform that collects metrics from monitored targets by scraping metrics HTTP endpoints on these targets.

Grafana is a dashboard used to visualize the collected data.

Official documentation is available here. 📖

1. Install Prometheus and Node Exporter

sudo apt-get install -y prometheus prometheus-node-exporter

2. Install Grafana

sudo apt-get install -y apt-transport-https
sudo apt-get install -y software-properties-common wget
sudo wget -q -O /usr/share/keyrings/grafana.key https://apt.grafana.com/gpg.key
echo "deb [signed-by=/usr/share/keyrings/grafana.key] https://apt.grafana.com stable main" | sudo tee -a /etc/apt/sources.list.d/grafana.list
sudo apt-get update && sudo apt-get install -y grafana

3. Enable services so they start automatically

sudo systemctl enable grafana-server prometheus prometheus-node-exporter

4. Create the prometheus.yml config file

Remove the default prometheus.yml configuration file and edit a new one.

sudo rm /etc/prometheus/prometheus.yml
sudo nano /etc/prometheus/prometheus.yml

Choose the tab for your consensus client. Paste the following configuration into the file.

global:
  scrape_interval:     15s # By default, scrape targets every 15 seconds.

  # Attach these labels to any time series or alerts when communicating with
  # external systems (federation, remote storage, Alertmanager).
  external_labels:
    monitor: 'codelab-monitor'

# A scrape configuration containing exactly one endpoint to scrape:
# Here it's Prometheus itself.
scrape_configs:
   - job_name: 'node_exporter'
     static_configs:
       - targets: ['localhost:9100']
   - job_name: 'lighthouse'
     metrics_path: /metrics    
     static_configs:
       - targets: ['localhost:8008']
   - job_name: 'lighthouse_validator'
     metrics_path: /metrics
     static_configs:
       - targets: ['localhost:8009']

5. Setup prometheus for your execution client

Append the applicable job snippet for your execution client to the end of prometheus.yml.

Spacing matters. Ensure all job_name snippets are in alignment.

   - job_name: 'geth'
     scrape_interval: 15s
     scrape_timeout: 10s
     metrics_path: /debug/metrics/prometheus
     scheme: http
     static_configs:
       - targets: ['localhost:6060']

Here's an example of a Lighthouse-Nethermind config:

global:
  scrape_interval:     15s # By default, scrape targets every 15 seconds.

  # Attach these labels to any time series or alerts when communicating with
  # external systems (federation, remote storage, Alertmanager).
  external_labels:
    monitor: 'codelab-monitor'

# A scrape configuration containing exactly one endpoint to scrape:
# Here it's Prometheus itself.
scrape_configs:
   - job_name: 'node_exporter'
     static_configs:
       - targets: ['localhost:9100']
   - job_name: 'Lighthouse'
     metrics_path: /metrics
     static_configs:
       - targets: ['localhost:5054']
   - job_name: 'validators'
     metrics_path: /metrics
     static_configs:
       - targets: ['localhost:5064']
   - job_name: 'nethermind'
     static_configs:
       - targets: ['localhost:6060']

To exit and save, press Ctrl + X, then Y, then Enter.

Update file permissions.

sudo chmod 644 /etc/prometheus/prometheus.yml

Restart the services.

sudo systemctl restart grafana-server prometheus prometheus-node-exporter

Verify that the services are running.

sudo systemctl status grafana-server prometheus prometheus-node-exporter

6. Create a SSH Tunnel to Grafana

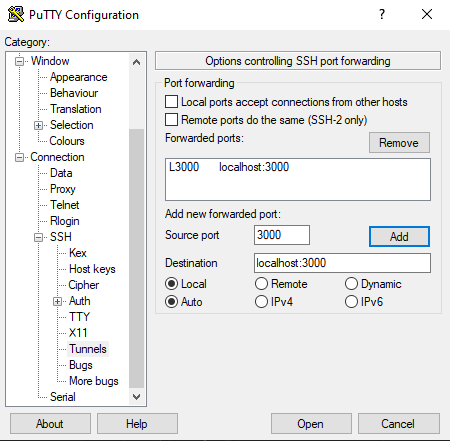
Each time you want to access Grafana, create a SSH tunnel with port 3000 forwarded.

Example of how to create a SSH tunnel in Linux or MacOS:

ssh -N -v <user>@<staking.node.ip.address> -L 3000:localhost:3000

#Full Example
ssh -N -v ethereum@192.168.1.69 -L 3000:localhost:3000

Now you can access Grafana on your local machine by pointing a web browser to http://localhost:3000

7. Setup Grafana Dashboards

  1. Login with admin / admin

  2. Change password

  3. Click the configuration gear icon, then Add data Source

  4. Select Prometheus

  5. Set Name to "Prometheus"

  6. Click Save & Test

  7. Download and save your consensus client's json file. More json dashboard options available below. [ Lighthouse | Teku | Nimbus | Prysm | Prysm > 10 Validators | Lodestar ]

  8. Download and save your execution client's json file [ Geth | Besu | Nethermind | Erigon | Reth ]

  9. Download and save a node-exporter dashboard for general system monitoring

  10. Click Create + icon > Import

  11. Add the consensus client dashboard via Upload JSON file

  12. If needed, select Prometheus as Data Source.

  13. Click the Import button.

  14. Repeat steps 12-15 for the execution client dashboard.

  15. Repeat steps 12-15 for the node-exporter dashboard.

🔥 Troubleshooting common Grafana issues

Symptom 1: Your dashboard is missing some data_._

Solution 1: Ensure that the execution or consensus client has enabled the appropriate metrics flag.

cat /etc/systemd/system/execution.service
cat /etc/systemd/system/consensus.service
  • Geth: --http --metrics --pprof

  • Besu: --metrics-enabled=true

  • Nethermind: --Metrics.Enabled true

  • Erigon: --metrics

  • Reth: --metrics 127.0.0.1:9001

  • Lighthouse: --validator-monitor-auto

  • Nimbus: --metrics --metrics-port=8008

  • Teku: --metrics-enabled=true --metrics-port=8008

  • Lodestar: --metrics true

Symptom 2: Don't want to use SSH tunnels and you want to expose port 3000 to access Grafana, but understand the security concerns.

Solution 2: Open port 3000 in your ufw firewall. Access grafana at http://<node ipaddress>:3000

sudo ufw allow 3000

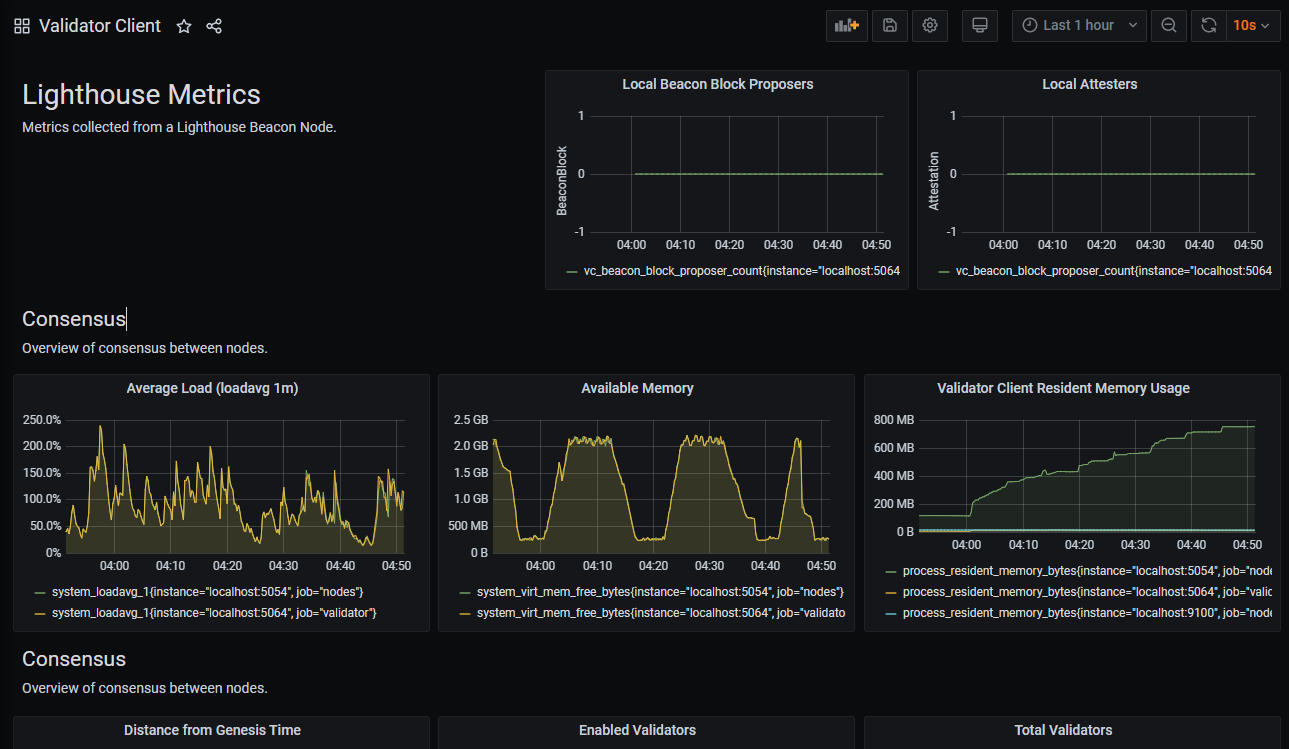
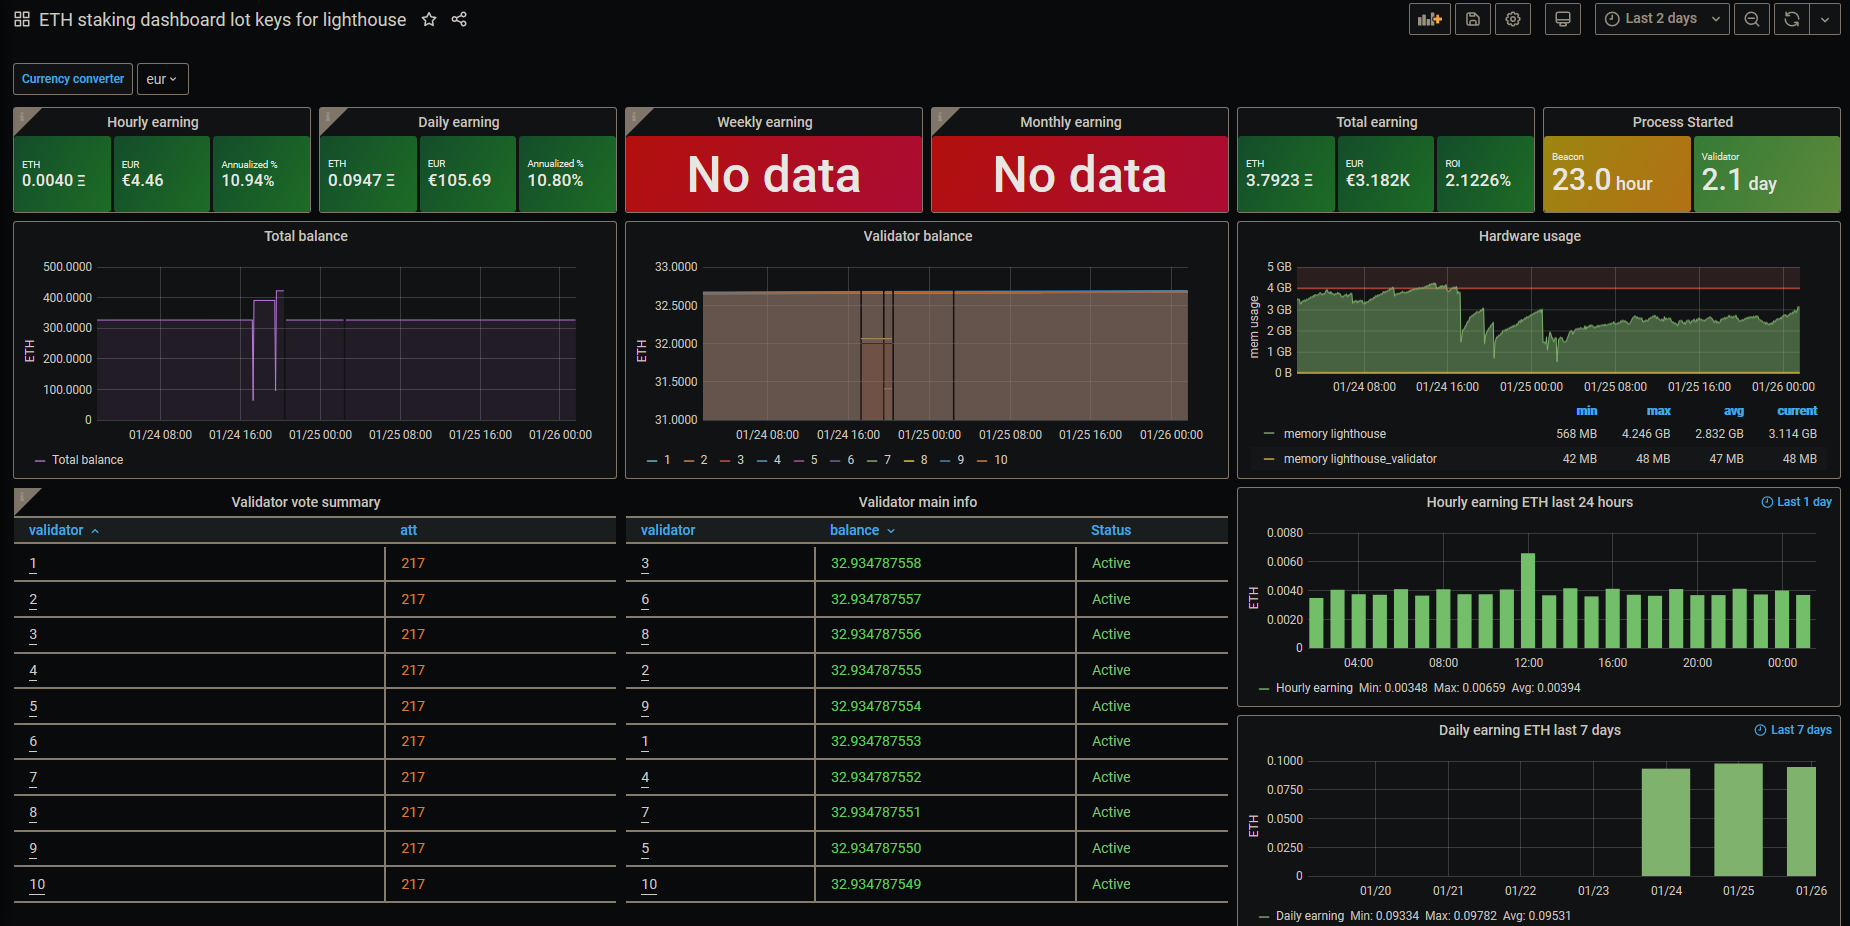
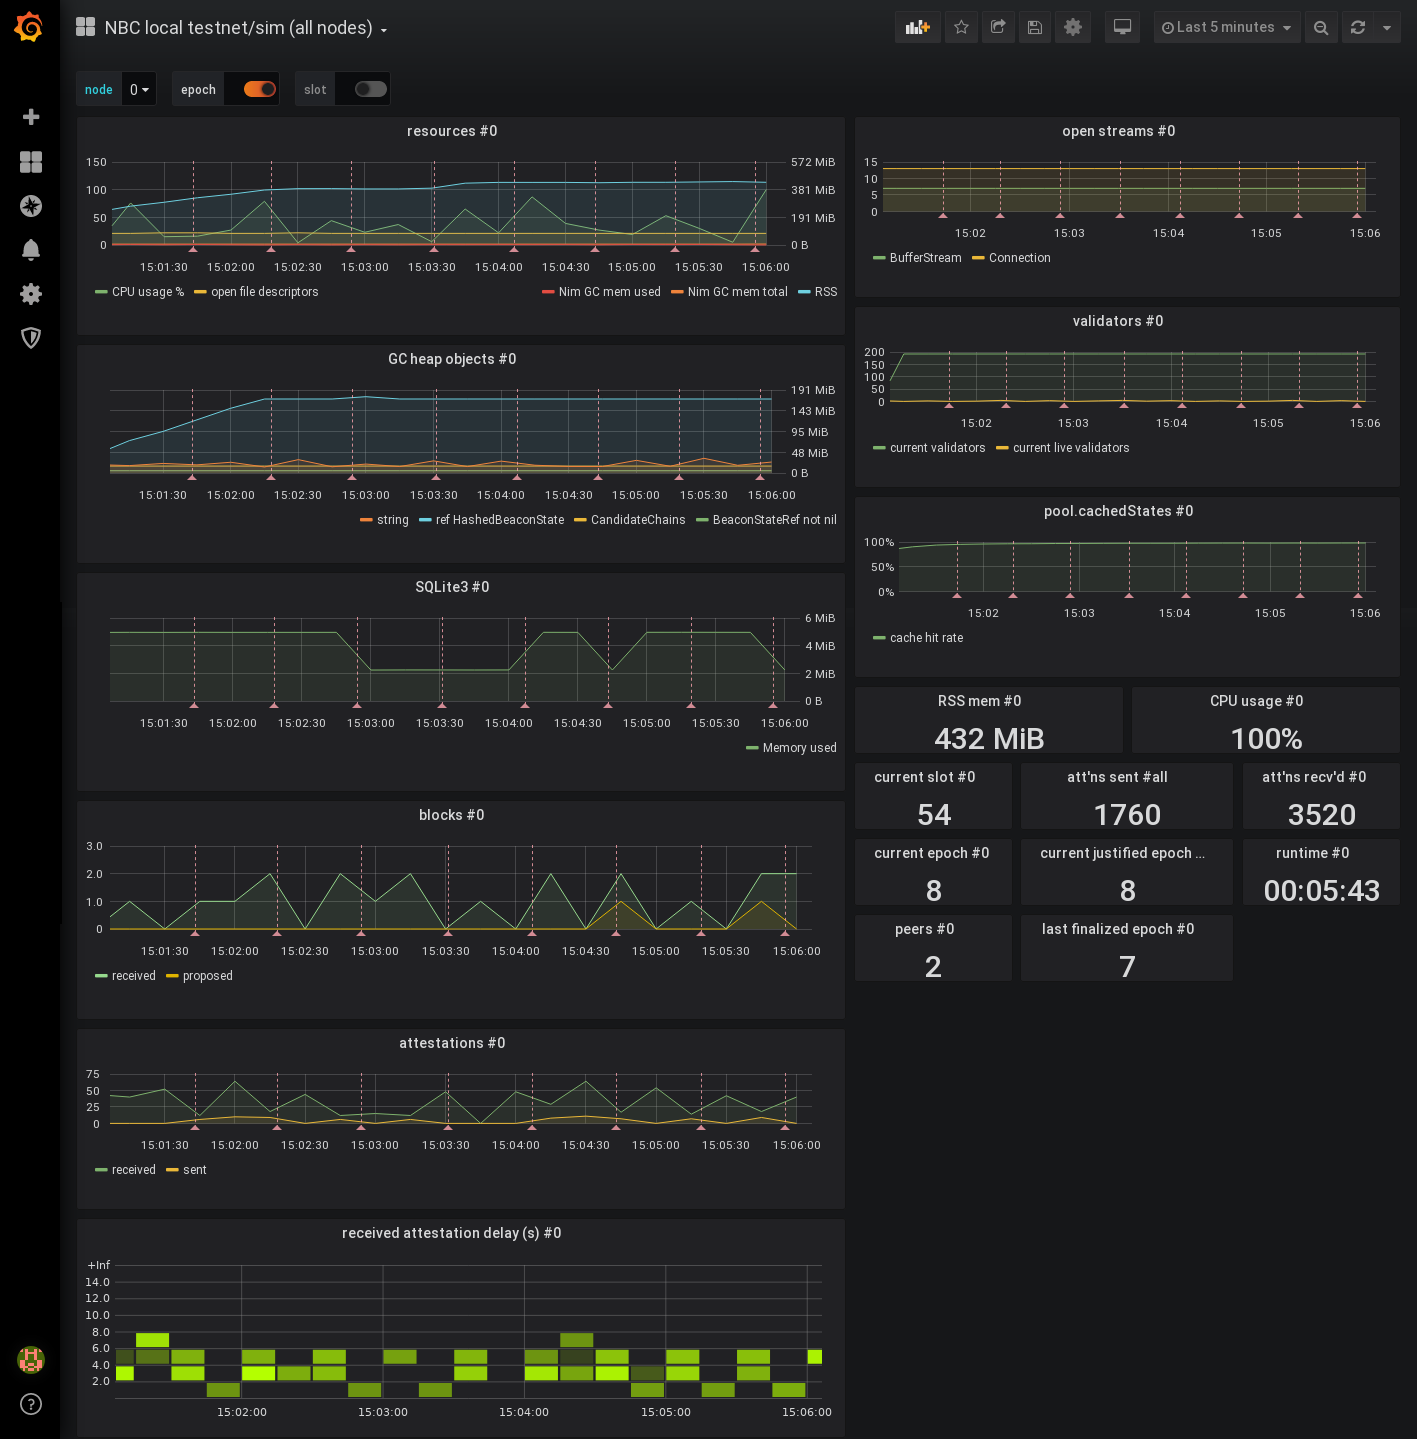
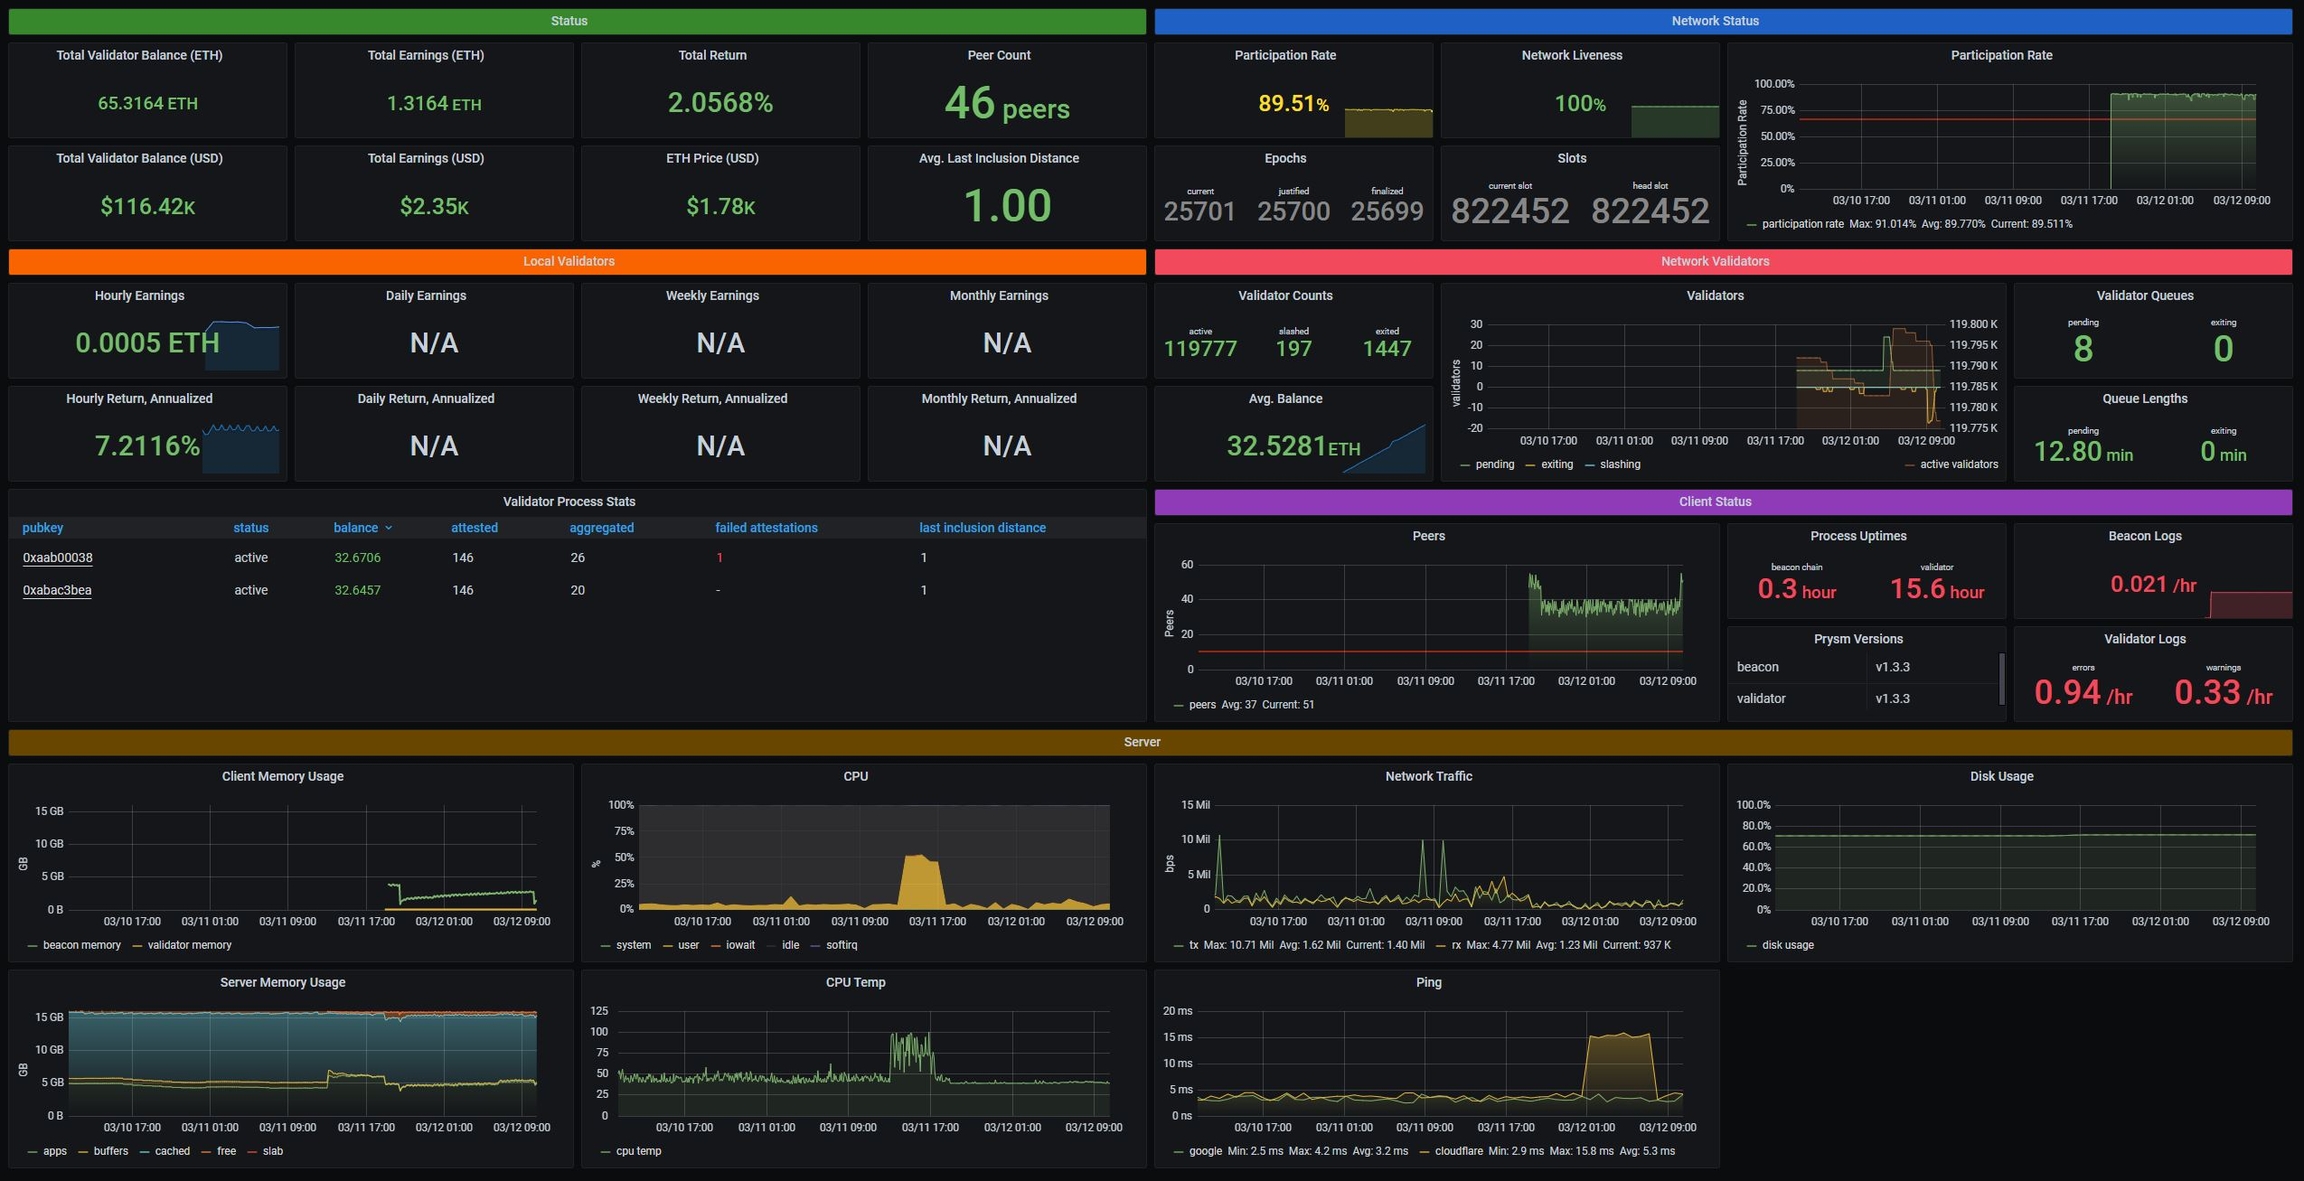
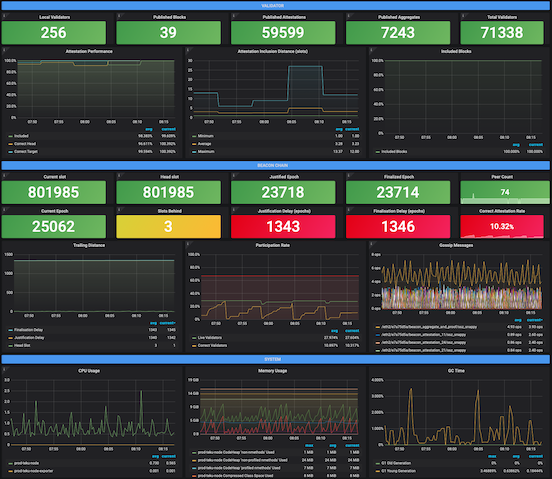
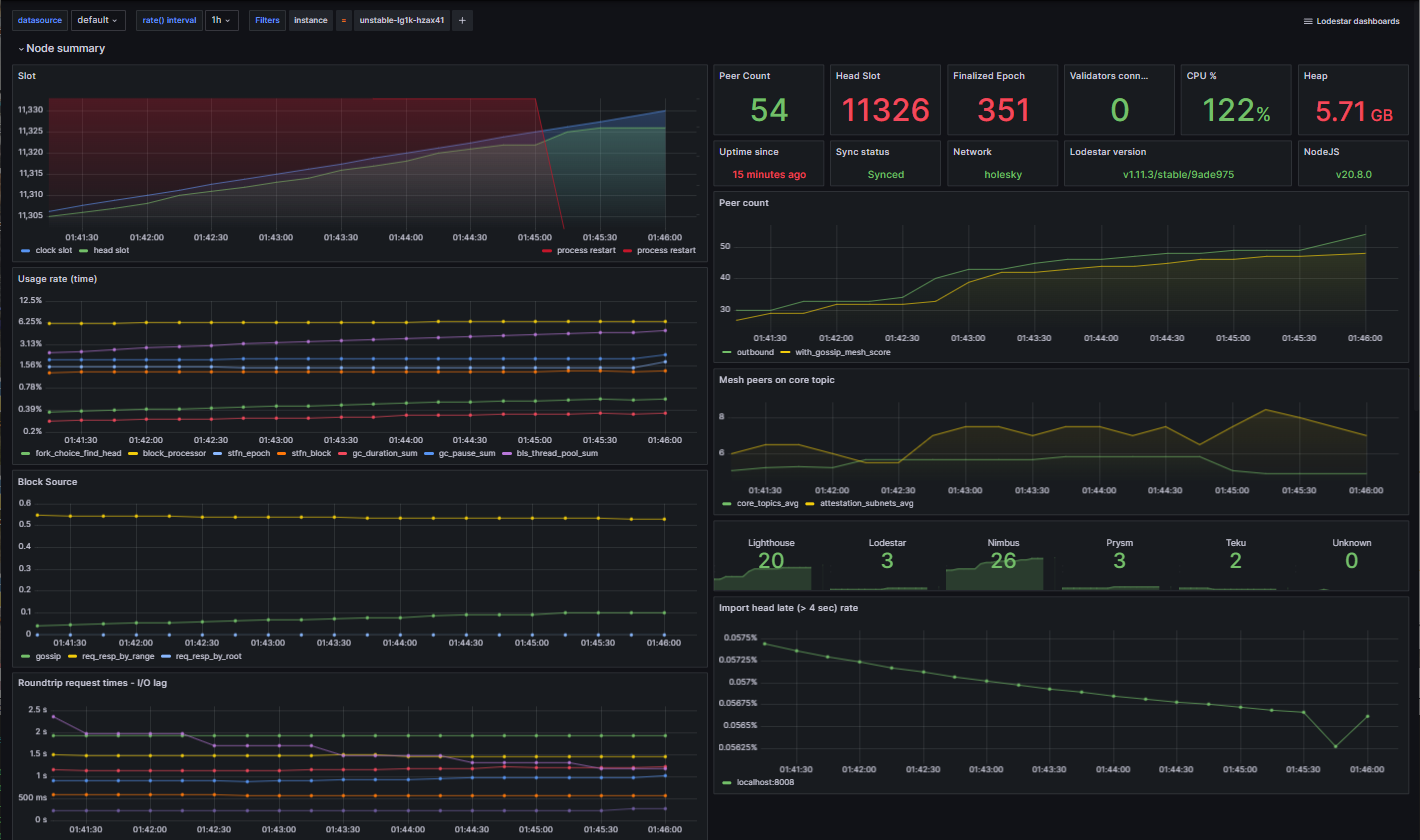
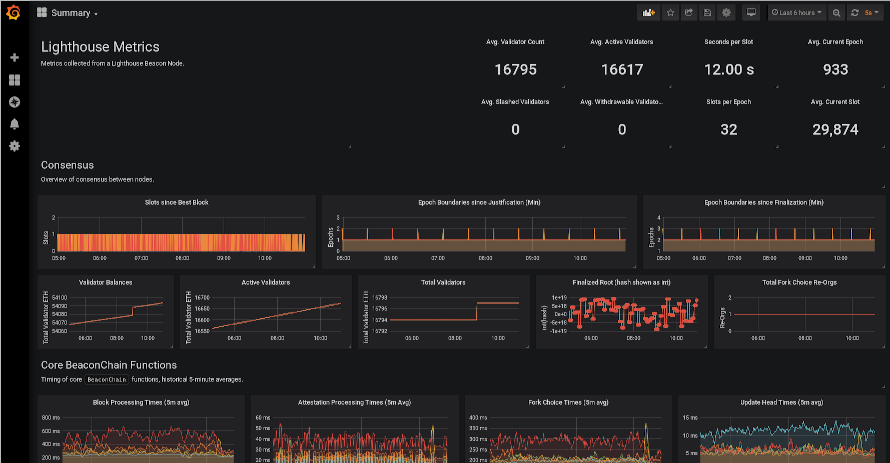
Example of Grafana Dashboards for each consensus client.
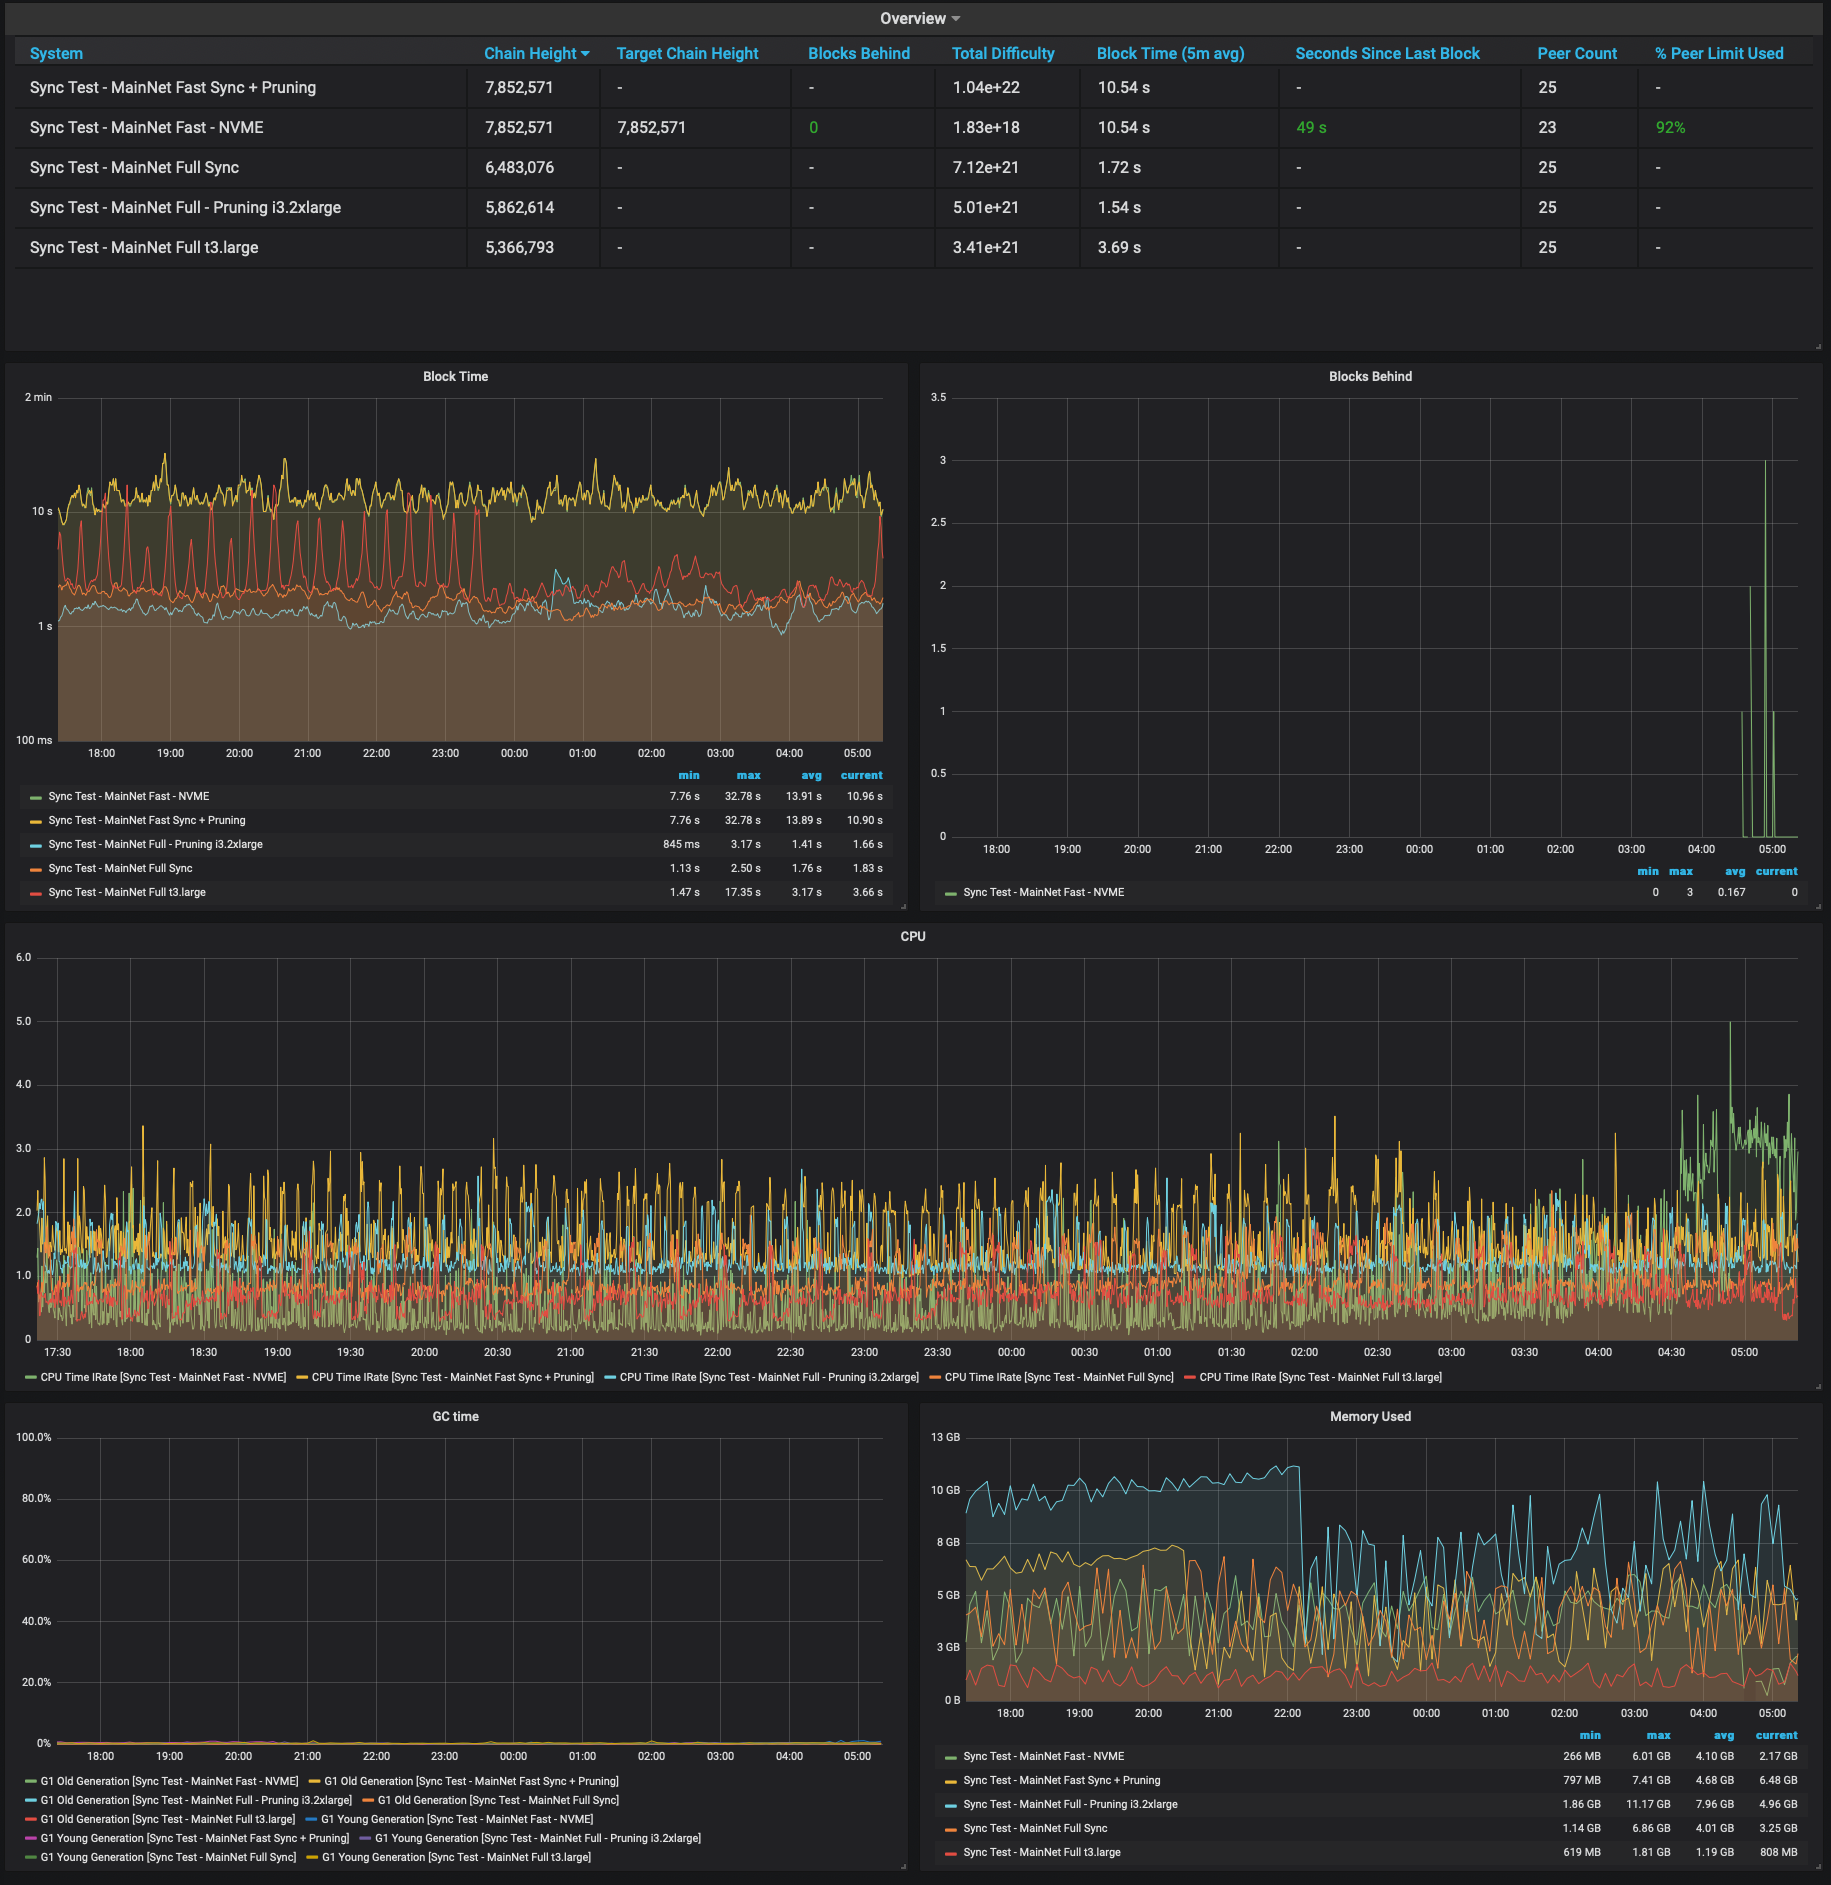
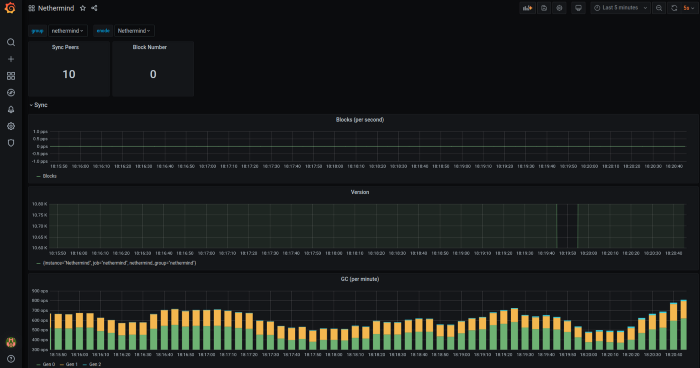
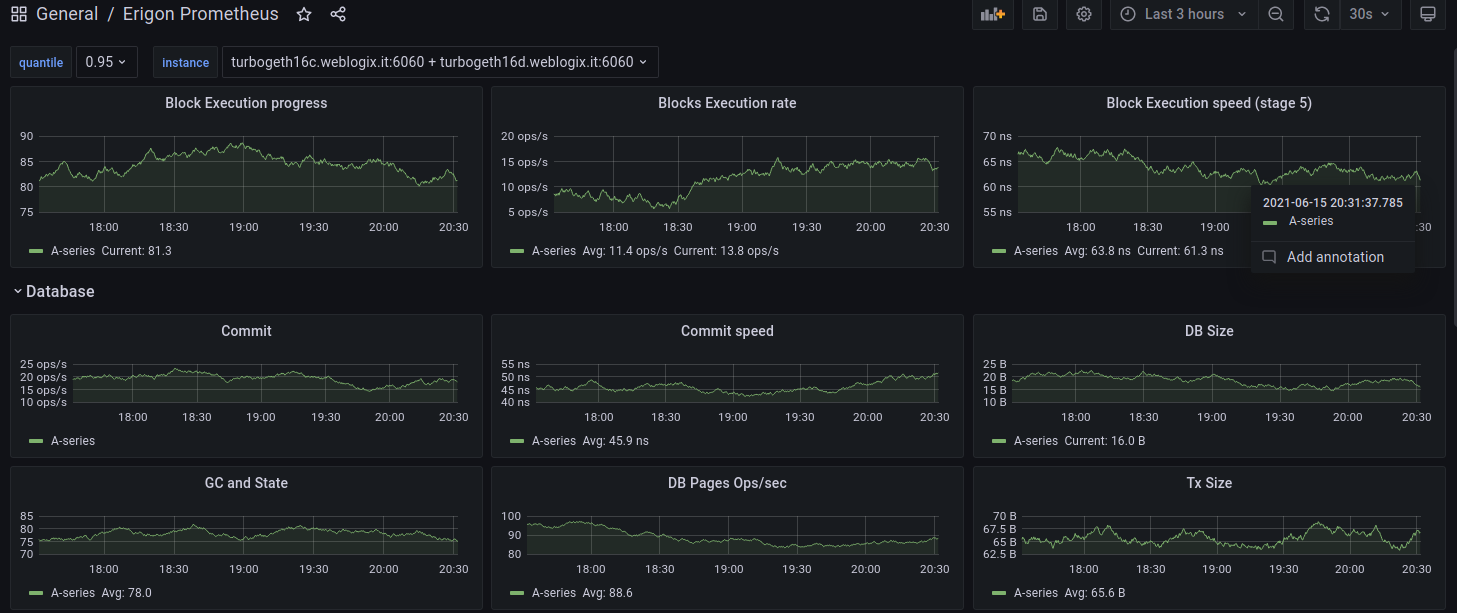
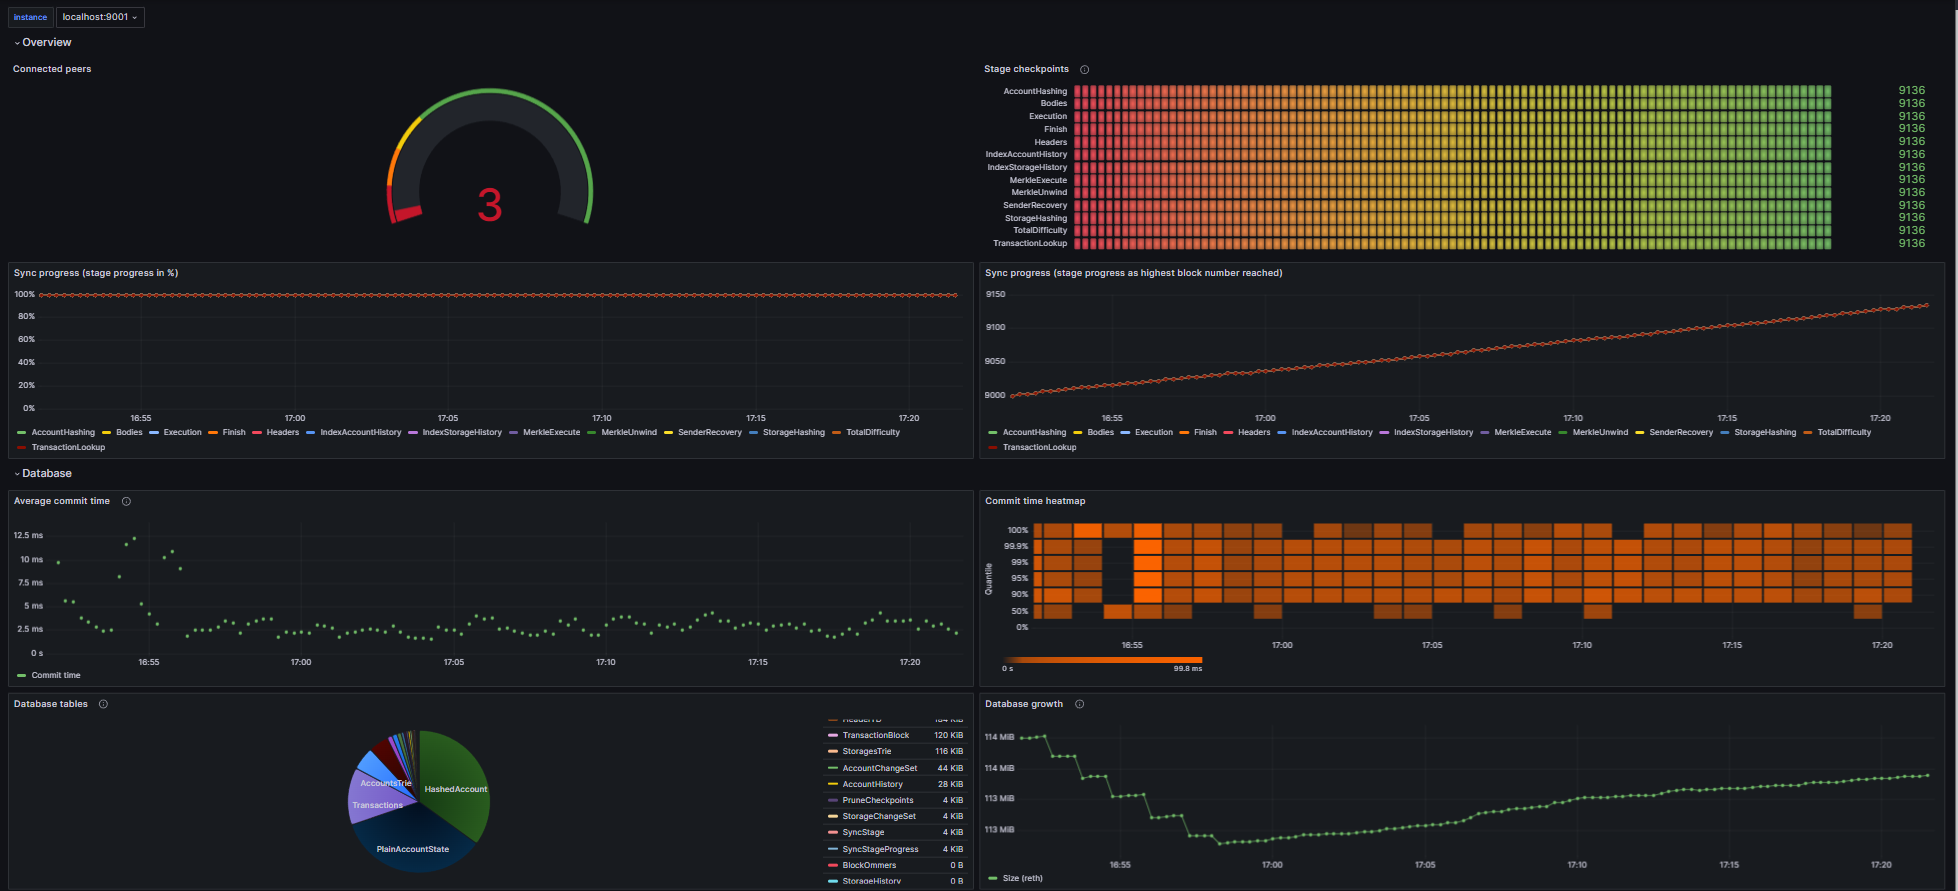
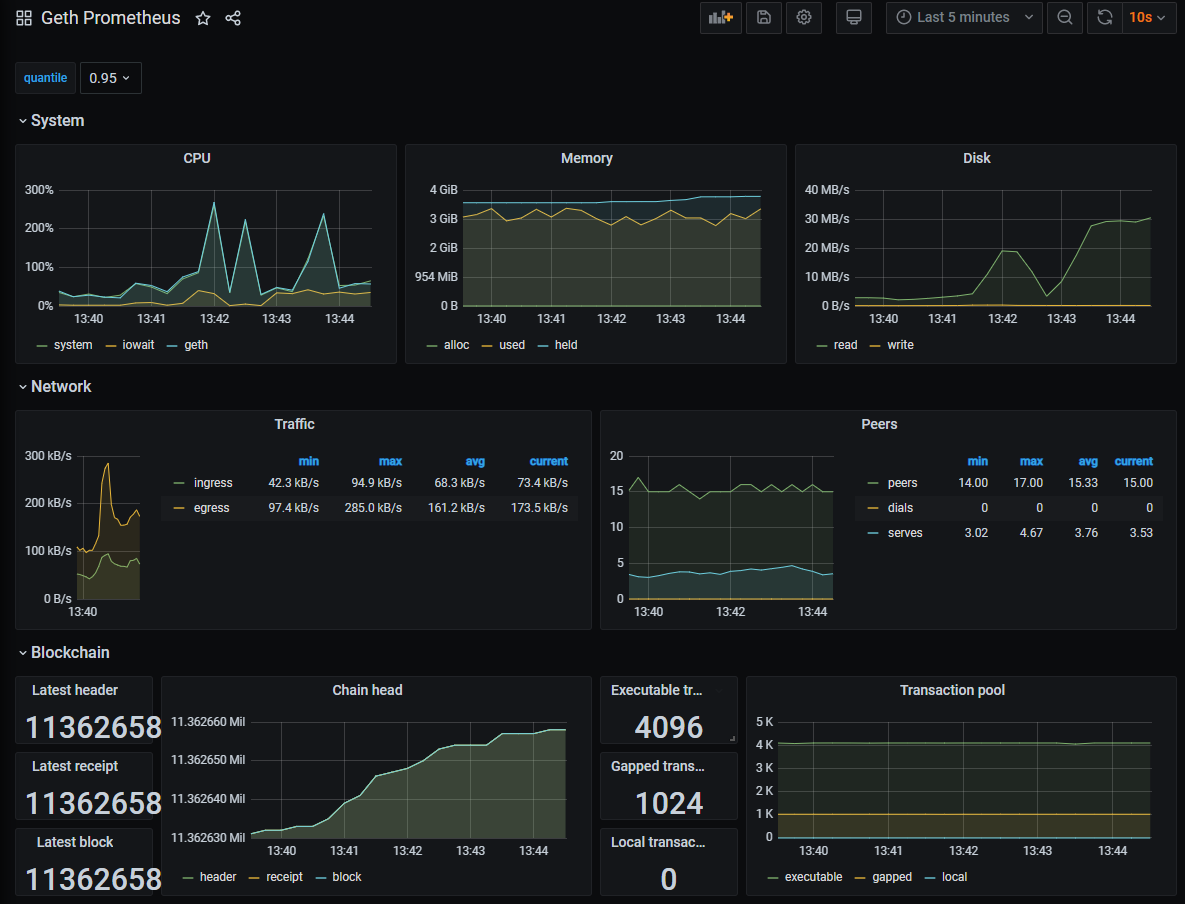
Example of Grafana Dashboards for each execution client.
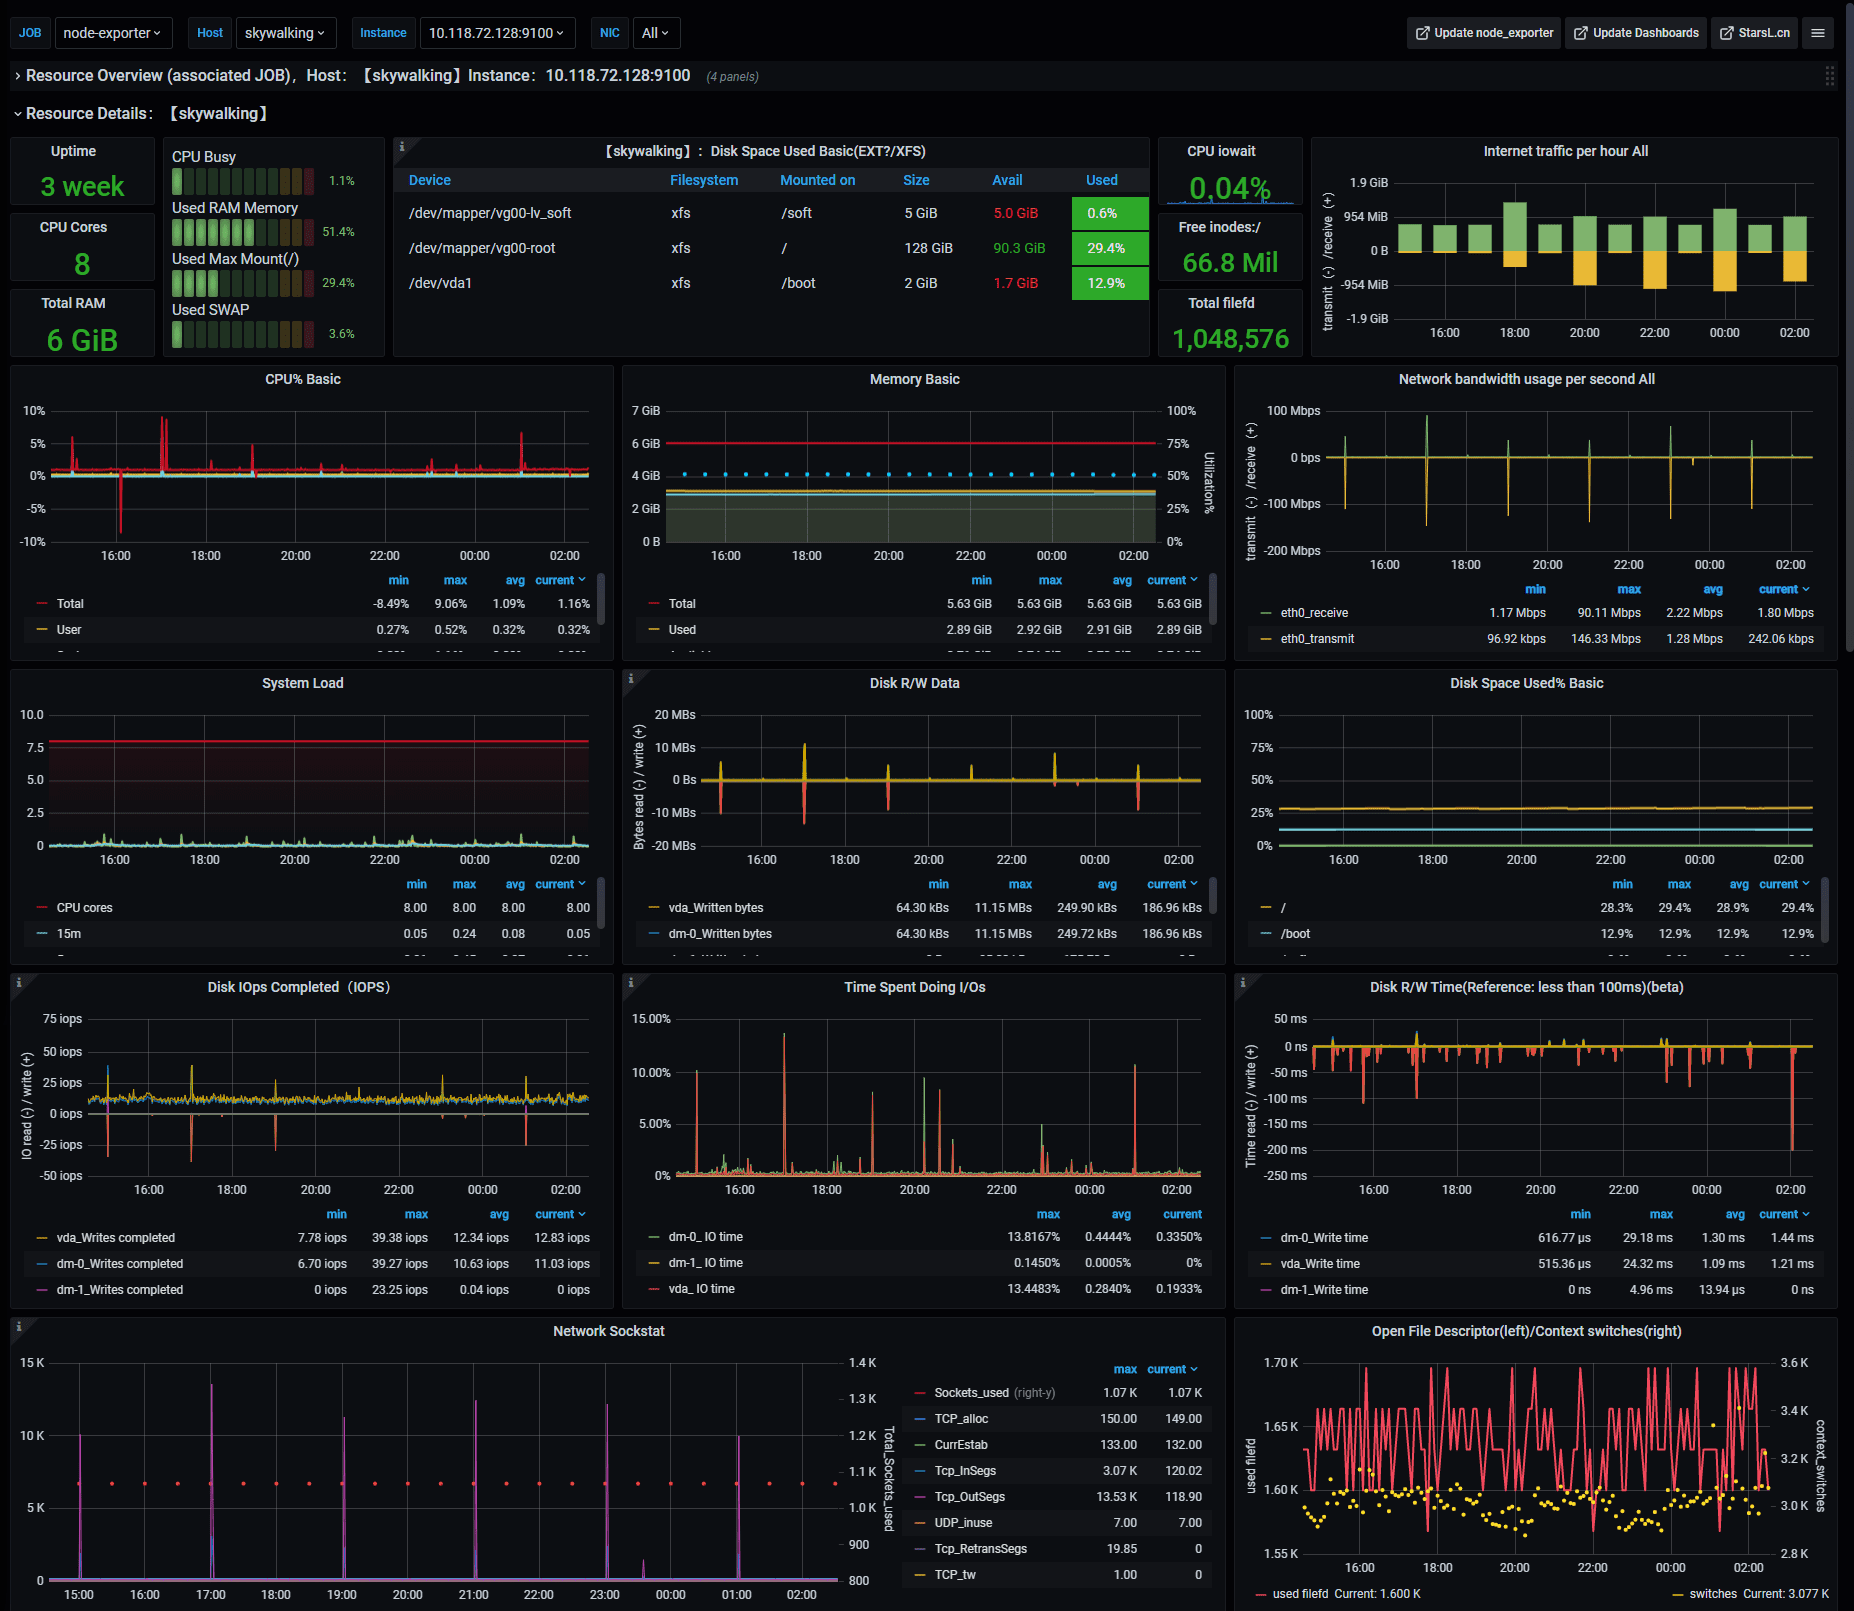
Example of Node-Exporter Dashboard
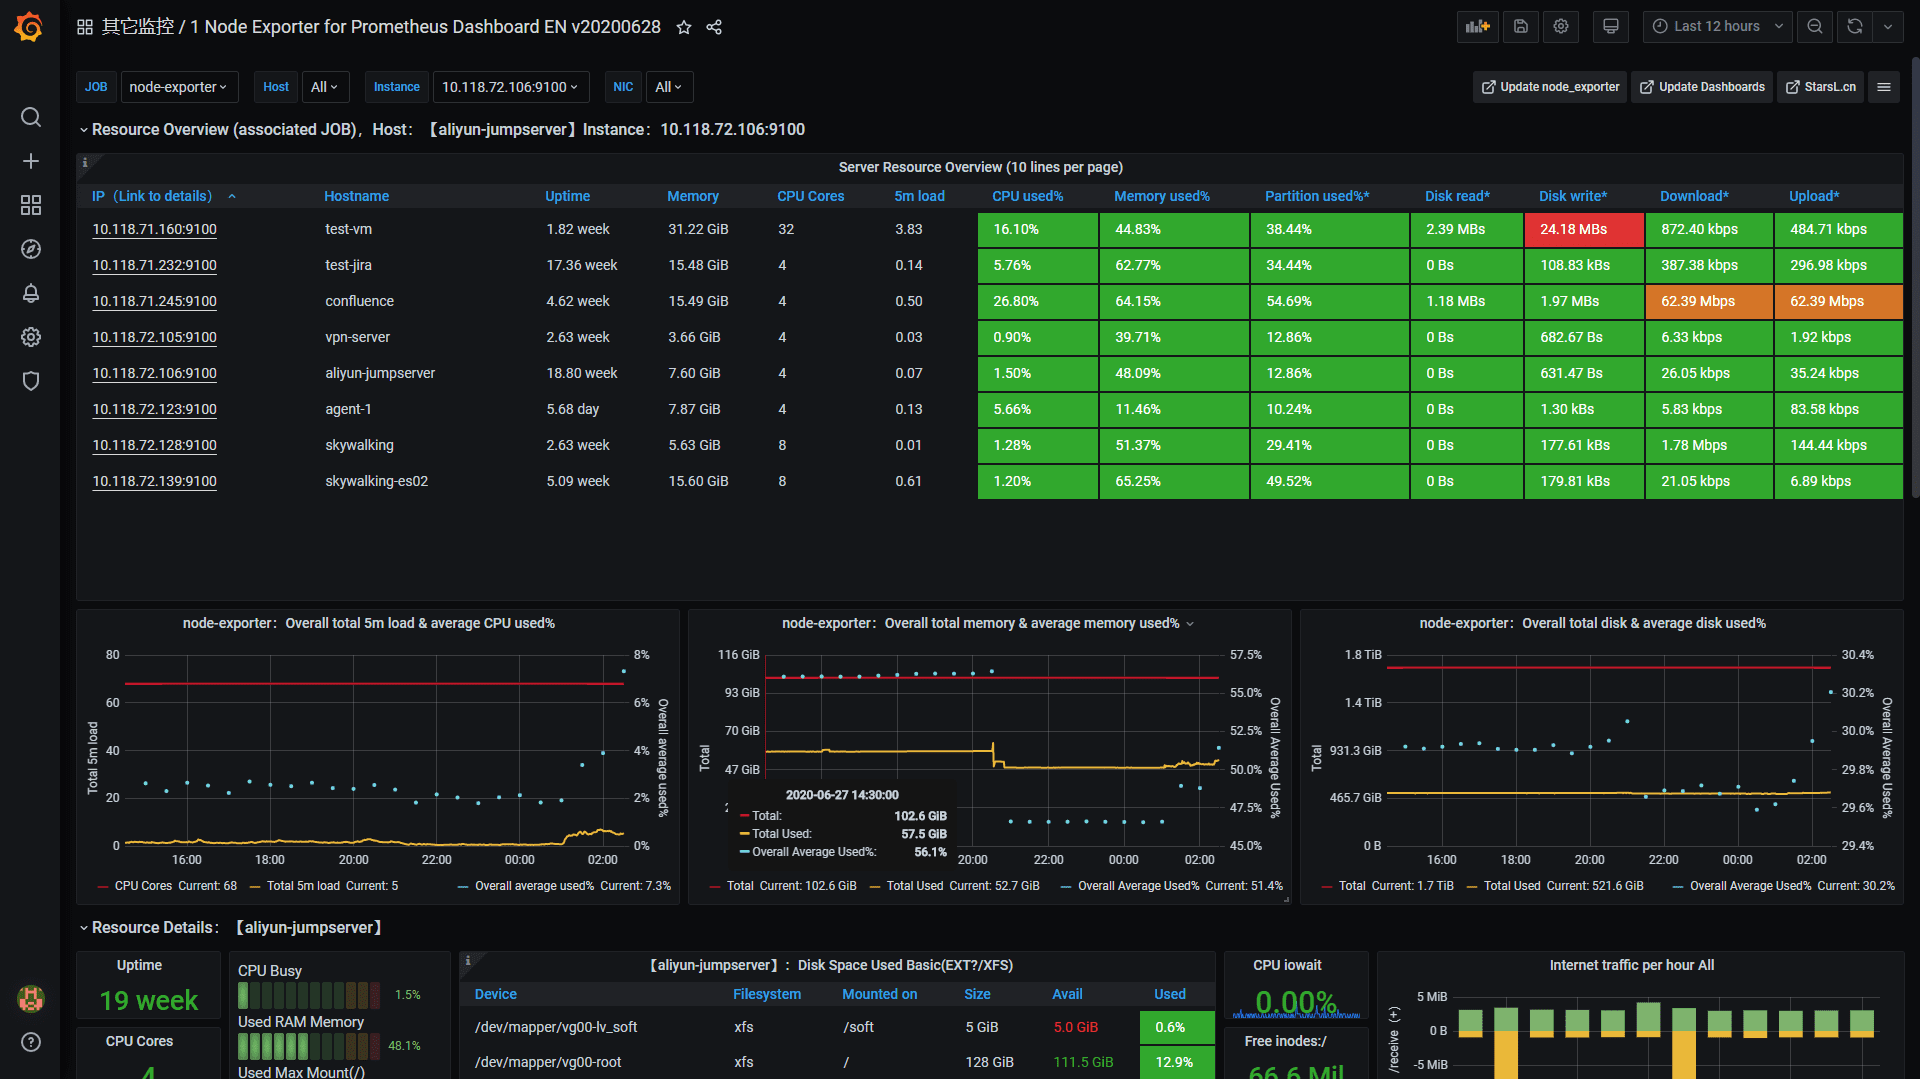
General system monitoring

Includes: CPU, memory, disk IO, network, temperature and other monitoring metrics。

Credits: starsliao

8. Setup Alert Notifications

Setup alerts to get notified if your validators go offline.

Get notified of problems with your validators. Choose between email, telegram, discord or slack.

Option 1: Email Notifications
  1. Sign up for an account

  2. Verify your email

  3. Search for your validator's public address

  4. Add validators to your watchlist by clicking the bookmark symbol.

Option 2: Telegram Notifications
  1. On the menu of Grafana, select Notification channels under the bell icon.

  2. Click on Add channel.

  3. Give the notification channel a name.

  4. Select Telegram from the Type list.

  5. To complete the Telegram API settings, a Telegram channel and **bot **are required. For instructions on setting up a bot with @Botfather, see this section of the Telegram documentation. You need to create a BOT API token.

  6. Create a new telegram group.

  7. Invite the bot to your new group.

  8. Type at least 1 message into the group to initialize it.

  9. Visit https://api.telegram.org/botXXX:YYY/getUpdates where XXX:YYY is your BOT API Token.

  10. In the JSON response, find and copy the Chat ID. Find it between **chat **and title. Example of Chat ID: -1123123123

    "chat":{"id":-123123123,"title":
  11. Paste the Chat ID into the corresponding field in Grafana.

  12. Save and test the notification channel for your alerts.

  13. Now you can create custom alerts from your dashboards. Visit here to learn how to create alerts.

Option 3: Discord Notifications
  1. On the menu of Grafana, select Notification channels under the bell icon.

  2. Click on Add channel.

  3. Add a name to the notification channel.

  4. Select Discord from the Type list.

  5. To complete the set up, a Discord server (and a text channel available) as well as a Webhook URL are required. For instructions on setting up a Discord's Webhooks, see this section of their documentation.

  6. Enter the Webhook URL in the Discord notification settings panel.

  7. Click Send Test, which will push a confirmation message to the Discord channel.

Option 4: Slack Notifications
  1. On the menu of Grafana, select Notification channels under the bell icon.

  2. Click on Add channel.

  3. Add a name to the notification channel.

  4. Select Slack from the Type list.

  5. For instructions on setting up a Slack's Incoming Webhooks, see this section of their documentation.

  6. Enter the Slack Incoming Webhook URL in the URL field.

  7. Click Send Test, which will push a confirmation message to the Slack channel.